webgl | 2024-03-18 19:53:48 2379次 1次
算法介绍
如何存储一条曲/折线?常见的方式就是使用使用一系列坐标点的集合来表示,点越多越密集,那么所能表示的精度就越高。在GIS画图的时候理想状况下,我们当然希望精度越高越好,但高精度的数据也会带来一些问题,比如对硬件系统的要求变高;比如在一些可视化场景里造成的渲染问题。
道格拉斯-普克算法正是用来解决这些问题的,它可以在保证一定精度的前提下,简化曲线的绘制过程,也是目前被广泛应用的GIS算法。基于线状实体的点压缩算法,用来压缩简化矢量数据。
算法流程
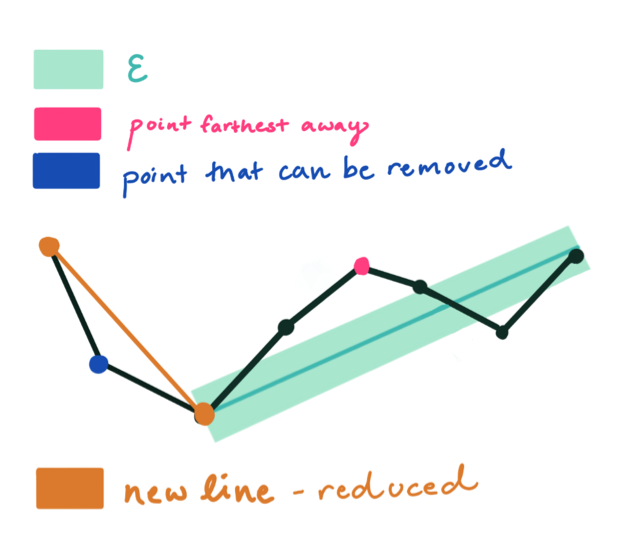
连接当前矢量曲线首尾点a、b,该直线AB为当前矢量曲线的弦;
计算首尾点a、b间所有坐标点到该弦AB的距离,并获取最大距离d及其的坐标点c;
比较最大距离d与给定的阈值thresholdVal,小于阈值,当前弦AB可作为曲线的近似【首尾间的坐标点将被抽稀】,该段矢量曲线处理完毕。
大于阈值,使用最大距离坐标点c分割当前矢量曲线,分割后的两段矢量曲线分别使用1~3的流程进行处理。
全部处理完毕后,依次连接各个分割点形成的折线,即可以作为整个曲线的近似。
图解


代码实现
function getDistance(p3, p1, p2) {
    let len;
    //如果p1.x==p2.x 说明是条竖着的线
    if(p1.x - p2.x == 0) {
        len = Math.abs(p3.x-p1.x)
    } else {
        const A = (p1.y-p2.y)/(p1.x-p2.x)
        const B = p1.y-A*p1.x
        len = Math.abs((A*p3.x+B-p3.y)/Math.sqrt(A*A+1))
    }
    return len;
}

function compressLine(input, start, end, dMax) {
    const queue = [{ start, end }];
    const result = [];
    while (queue.length > 0) {
        const { start, end } = queue.shift();
        if (start >= end) {
            continue;
        }
        let maxDist = 0;
        let currentIndex = start;
        for (let i = start + 1; i < end; i++) {
            const currentDist = getDistance(input[i], input[start], input[end]);
            if (currentDist > maxDist) {
                maxDist = currentDist;
                currentIndex = i;
            }
        }
        if (maxDist >= dMax) {
            result.push(input[currentIndex]);
            queue.push({ start, end: currentIndex });
            queue.push({ start: currentIndex, end });
        }
    }
    return result;
}

/**
 *
 *@param input 原始数据
 *@param dMax 阈值
 *@return 抽希数据
 */
function douglasPeucker(input, dMax = 6 ){
    if (!input || !(input.length > 2)) {
        return null;
    }
    let result = [input[0], ...compressLine(input, 0, input.length - 1, dMax), input[input.length - 1]];
    return result;
}

const threshold = 6;
const input = [{
x: 10,
y: 60
}, {
x: 12,
y: 46
}, {
x: 15,
y: 36
}, {
x: 23,
y: 29
}, {
x: 28,
y: 34
}, {
x: 30,
y: 46
}, {
x: 30,
y: 56
}, {
x: 27,
y: 66
}, {
x: 26,
y: 76
}, {
x: 30,
y: 85
}, {
x: 34,
y: 87
}, {
x: 40,
y: 78
}, {
x: 42,
y: 72
}, {
x: 43,
y: 60
}, {
x: 44,
y: 51
}, {
x: 46,
y: 38
}, {
x: 46,
y: 26
}, {
x: 49,
y: 17
}, {
x: 58,
y: 11
}, {
x: 63,
y: 24
}, {
x: 61,
y: 38
}, {
x: 60,
y: 55
}, {
x: 59,
y: 67
}, {
x: 58,
y: 82
}, {
x: 64,
y: 90
}, {
x: 68,
y: 91
}, {
x: 79,
y: 89
}, {
x: 84,
y: 82
}, {
x: 85,
y: 70
}, {
x: 83,
y: 60
}, {
x: 80,
y: 50
}, {
x: 79,
y: 36
}, {
x: 82,
y: 26
}, {
x: 86,
y: 20
}, {
x: 94,
y: 17
}, {
x: 113,
y: 15
}, {
x: 127,
y: 19
}, {
x: 133,
y: 28
}, {
x: 134,
y: 40
}, {
x: 134,
y: 53
}, {
x: 131,
y: 62
}, {
x: 124,
y: 72
}, {
x: 116,
y: 76
}, {
x: 105,
y: 77
}, {
x: 99,
y: 73
}, {
x: 94,
y: 63
}, {
x: 95,
y: 50
}, {
x: 102,
y: 41
}, {
x: 111,
y: 34
}, {
x: 123,
y: 42
}, {
x: 122,
y: 53
}, {
x: 116,
y: 61
}, {
x: 109,
y: 64
}, {
x: 106,
y: 58
}];

douglasPeucker(input, threshold);1人赞
Copyright©2019